The stock market has just completed the first half of 2019 with the strongest opening six month increase of any year since 1997. This statistic alone has prompted many investors to question the durability of the current economic and market cycle. In this post, we look at the current state of the global economy and the characteristics of market cycles.
“When America sneezes, the World catches a cold”
This widely used saying dates back to Austrian politician Klemens von Metternich (1773 – 1859) who, at the time of Napoleon, penned the phrase “When Paris sneezes, Europe catches a cold.” Economists and politicians have amended Metternich’s words to reflect America’s dominant role in global economics since the start of the twentieth century. Today, this phrase may be particularly apposite.
The more protectionist stance by the current administration, apparently supported by many across the political spectrum, has clearly sent a chill wind across many economies. Imports make up a relatively small, 15%, portion of U.S. Gross Domestic Product (GDP). However, given the size of the U.S. economy compared to all its trading partners, this relatively small number for the U.S. translates into the country being the largest export market for much of the developed world and China. Any move to reduce imports into the U.S., whether by recession, differential tax policies or by imposing tariffs, was always going to have a significant impact on global economic activity.
We can see one effect of this in the sharp deterioration in the German economy. German manufacturing orders have slumped due to a sharp reduction in export orders: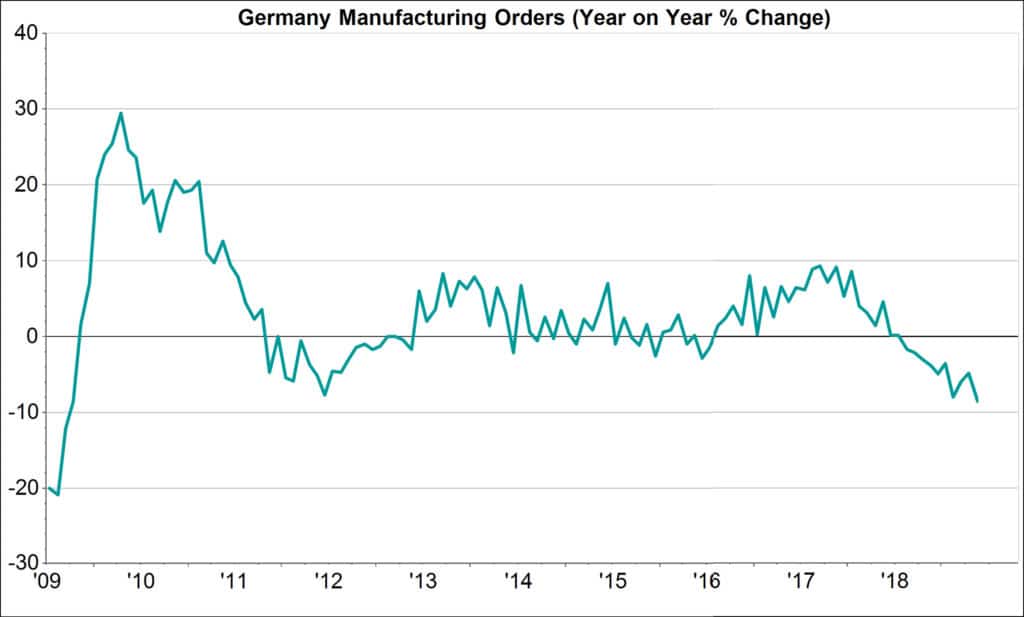 German Exports are declining at the fastest rate since the financial crisis. This fall in manufacturing activity has contributed to a sharp increase in unemployment:
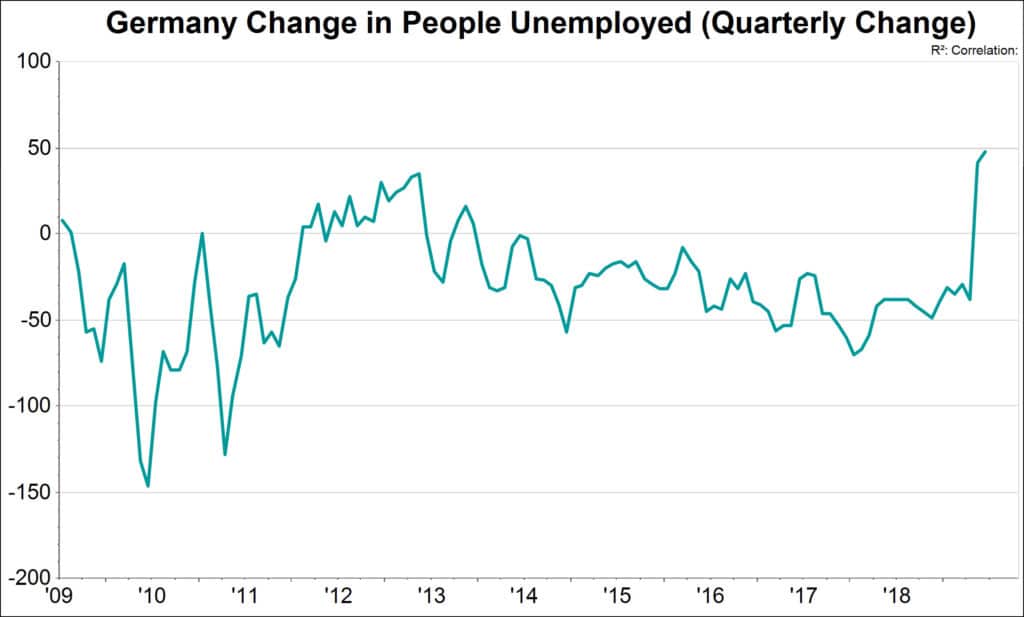 Germany is the fourth largest economy but ‘only’ a fifth of the size of the U.S. Data also suggests significant stress in China, Japan and the UK. Together these countries represent approximately 30% of the total world economy.
There has also been some loss of energy in the U.S. economy. Manufacturing activity, as shown by this measure from the Institute of Supply Management (ISM), has clearly lost momentum, although it is still in expansionary territory with the index still above 50: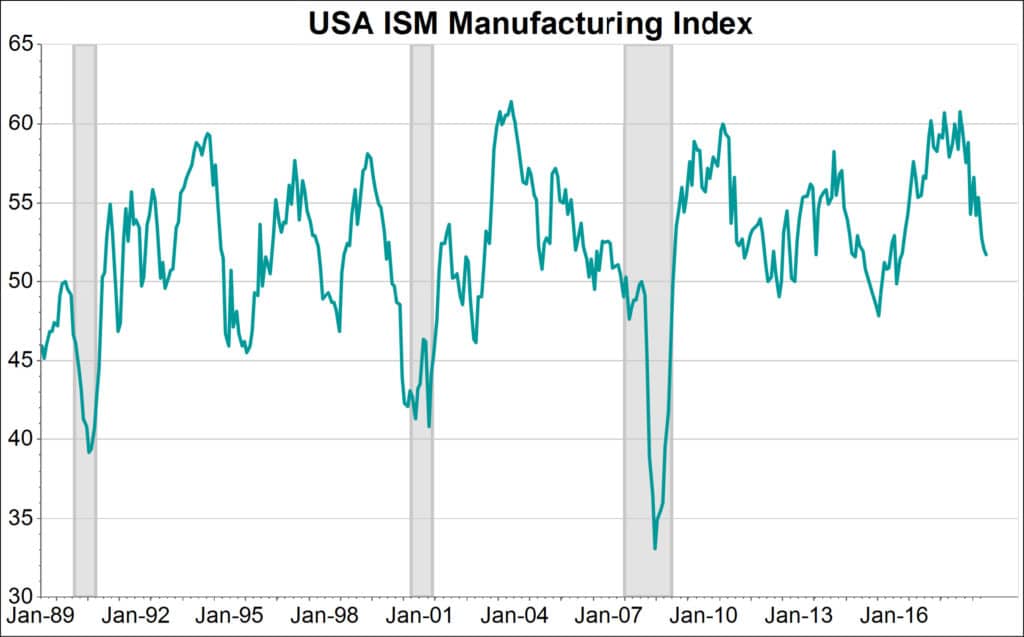 The world’s reduction in growth is concerning. After the financial crisis of 2008 / 2009, central banks in the developed economies and China reduced interest rates dramatically and put in place other forms of monetary stimulation. Except for the U.S. all these policies are still very much in place, with European interest rates at zero and the UK and Japan only a little higher.
The question now is “what scope is there for central banks to ease further and help prevent another recession?” The answer would appear to be very little. Many of these economies also have limited scope for fiscal stimulus, mainly through government spending and tax cuts, although Germany and France seem capable of significant action. The UK has promised a stimulus package once Brexit has been delivered and China has put in place a $1 trillion spending program. So, it does seem likely policymakers will put in place programs in the coming months to stimulate economic activity rather than risk a significant rise in unemployment. The U.S. currently seems far from recession territory but here, the main scope seems to be through action from the Federal Reserve Bank. Measures could include a potential cut in interest rates as well as an ending of quantitative tightening.
Is it different this time?
According to the National Bureau of Economics, the U.S. is now in its longest period of economic expansion since records began in 1854. Of course, five years of this ten-year period involved restoring the economy to previous peak levels after the financial crisis. It was only in May 2014 that industrial production recovered to the same level reported in March 2008. This was an exceptionally long recovery and compares with the three years after the September 2000 peak.
In our previous newsletter, we suggested that secular bull markets for stocks can last far longer than many investors tend to believe. This comment is entirely consistent with periodic corrections, including some of significant magnitude. The following chart shows the pattern for the S&P 500 over the last ninety-two years. The shaded areas show extended periods when stocks tracked sideways. This means if an investor had bought the market at the start of the shaded period and held until the end, there would have been no capital gain. The unshaded areas show secular bull markets. In the 1950s and early 1960s, investor enthusiasm was driven by industrial advances based on technology developed during World War II. In the 1980s and 1990s, significant technological changes again drove economic and corporate profit growth. Both periods were associated with significant corrections such as the mini bear market in 1957 to mid-1958 and again for six months in 1962.
During the ten-fold rise in markets over the twenty years from June 1980, the October ‘crash’, sometimes called ‘Black Monday’, lasted just four months. The market did not regain its previous highs until two years later. The pattern of these secular bull markets is particularly interesting and may bear relevance to the position of markets today.
Looking at these past secular uptrends, we can also see that the initial rise after the recovery phase from a financial crisis is seven years followed by a correction and then a further eight to nine-year uplift: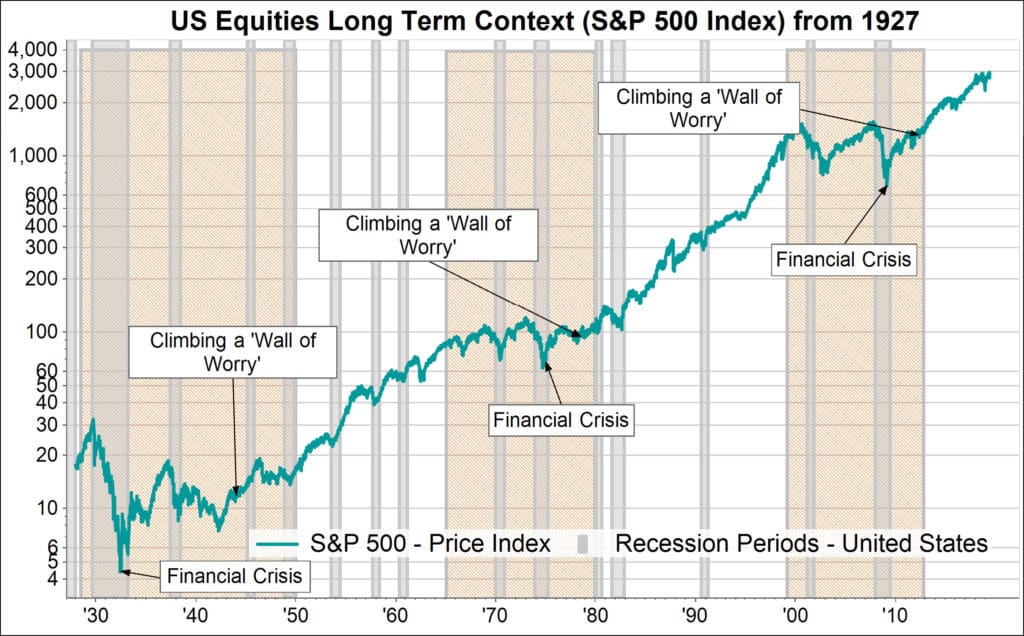 It is always possible that it really is different this time but as the chart shows, there does appear to be a repeatable cycle.
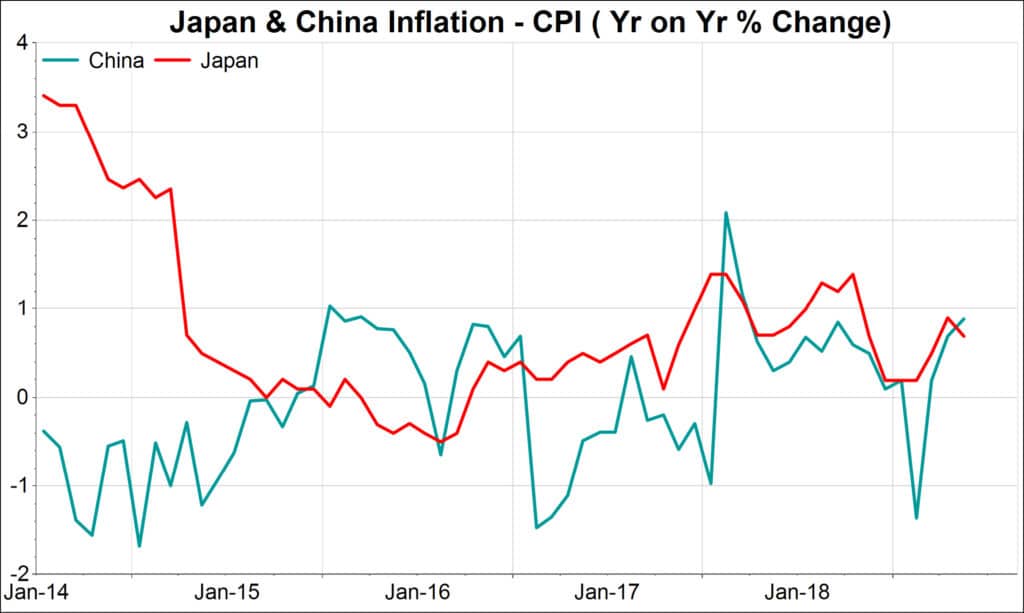
Of course, there are differences now compared with history. Inflation is undoubtedly much lower and seems to be heading even lower: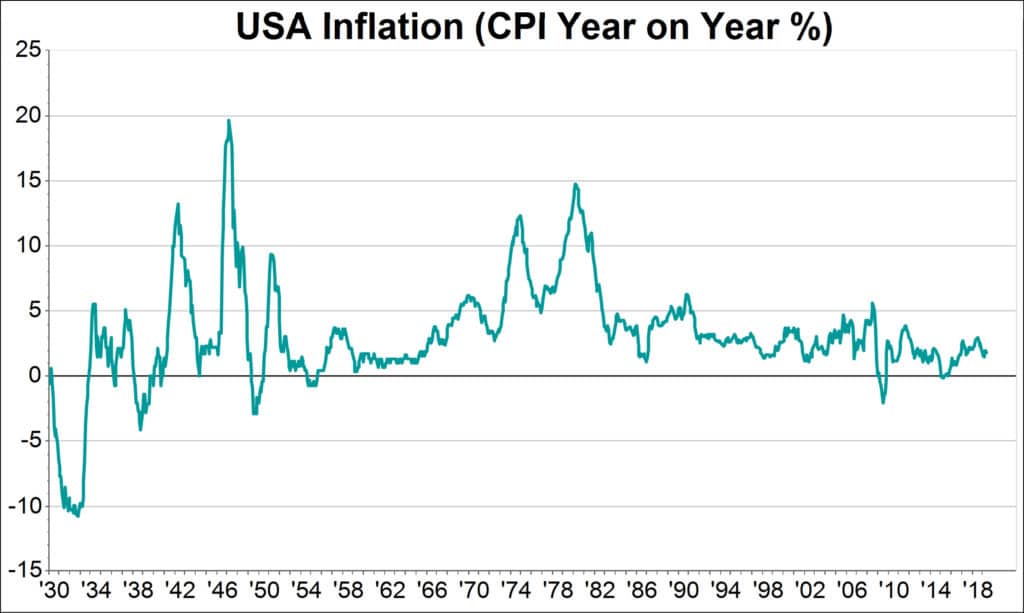 Globally, some countries appear to be flirting yet again with deflation:
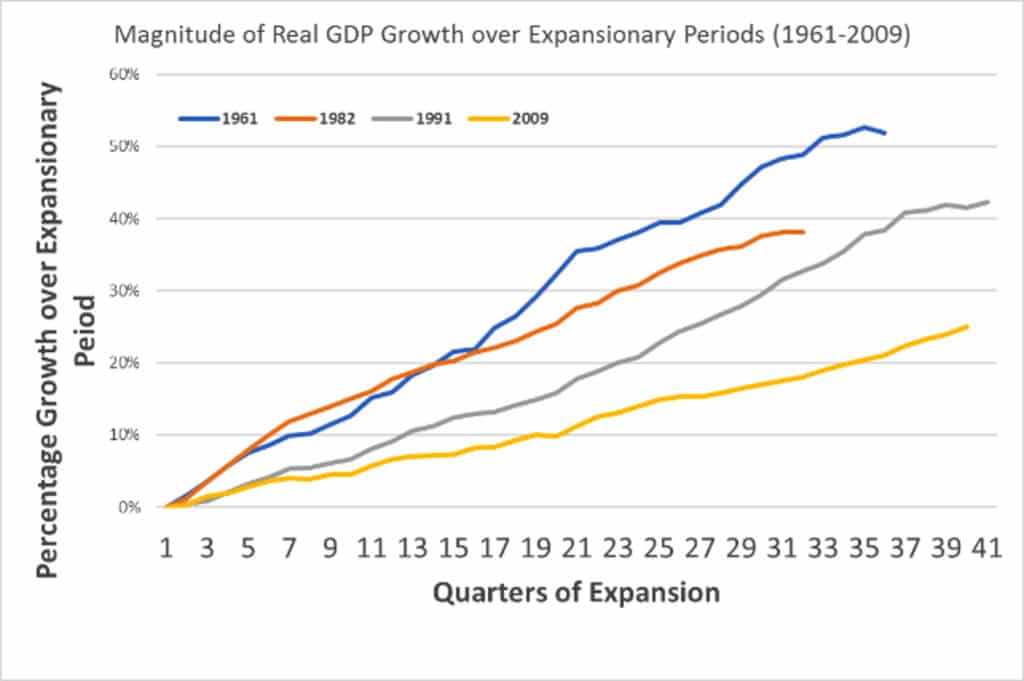
 We can also see that although the expansion has lasted longer than any others in history, the extent of ‘Real’ GDP growth has been more subdued than any of the expansionary periods since 1960:
 The interest rate and credit environment is very different from the end of other periods of economic expansion. Normally, increasing inflation would prompt central banks to tighten monetary conditions through higher interest rates and tougher lending standards. This is clearly not the case globally except for the actions of the Federal Reserve Bank (Fed).
Globally, interest rates have never been lower since the Medicis introduced modern day banking in Fifteenth-century Florence. Today, nearly $12.5 trillion of government bonds currently trade or are being issued with a negative yield. In the case of Germany, government bonds out to a fifteen-year maturity provide no interest payments. Investors are lending money to the German government and receiving no return. In effect they are paying the German government for the privilege of lending them money. Cosimo Medici (1389 – 1464) would find this totally unacceptable, as in 1402 he sacked his branch manager for unwisely lending to Germans!
In addition to condoning this strange market position though zero interest rates, the European Central Bank (ECB) continues to print money. It is doing this by purchasing debt from banks and governments and more recently has extended this to buying corporate bonds. As a result, the ECB now has investments totaling $5.25 trillion. Interestingly, the Bank of Japan has a similar amount although the Japanese central bank governor has extended their remit to include domestic equities as well as debt.
The Fed held a maximum of $4.6 trillion in government securities as well as corporate and bank-related debt. Over the last eighteen months, the size of the assets held has been reduced to less than $3.9 trillion – a reduction of around $700 billion. In other words, there has been a transfer from private investors to the government equivalent to 3.5% of total U.S. GDP. This represents significant monetary tightening.
Recent comments from the Federal Reserve Bank suggest policy will move to reverse some of these measures, which should stimulate demand and support risk assets such as equities.
So, the answer to the question whether it is different this time, is a qualified no. The expansion can continue but given the state of global economies, there are clear risks which could produce a stock market correction.
Our investment policy continues to favor stocks with the ability to grow their earnings and dividends rather than more defensive companies. In order to offset what we see as growing risks to the economic environment, investment policy also favors a reasonable balance of low-risk, short- dated bonds.
Managing portfolio volatility during periods of uncertainty is an important part of any investment manager’s role. In this way we expect to capture most of the upside in equity returns but provide some protection against inevitable stock market corrections.
Written by:
Trevor Forbes
President and Chief Investment Officer
Source of all graphs: FactSet
This newsletter is limited to the dissemination of general information pertaining to Renaissance’s investment advisory services. It is for informational purposes only and should not be construed by a consumer and/or prospective client as a solicitation to effect, or attempt to effect transactions in securities, or the rendering of personalized investment advice for compensation. Renaissance’s specific advice is given only within the context of our contractual agreements with each client. Advice may only be rendered after delivery of Form ADV Part 2 and the execution of an agreement by the client and Renaissance.


