Yes, ten years have passed since March 12 2009 when stocks started to rise after the worst stock market collapse since the Great Depression. Since then, the S&P 500 Index has risen 273%. A decade seems a long time for a bull market without a ‘proper’ correction. The length and extent of the rise in stocks in the USA has led some to call this The Great Bull Market while others have been calling an end to the rise virtually since it started. This has truly been one of the most unloved bull markets on record.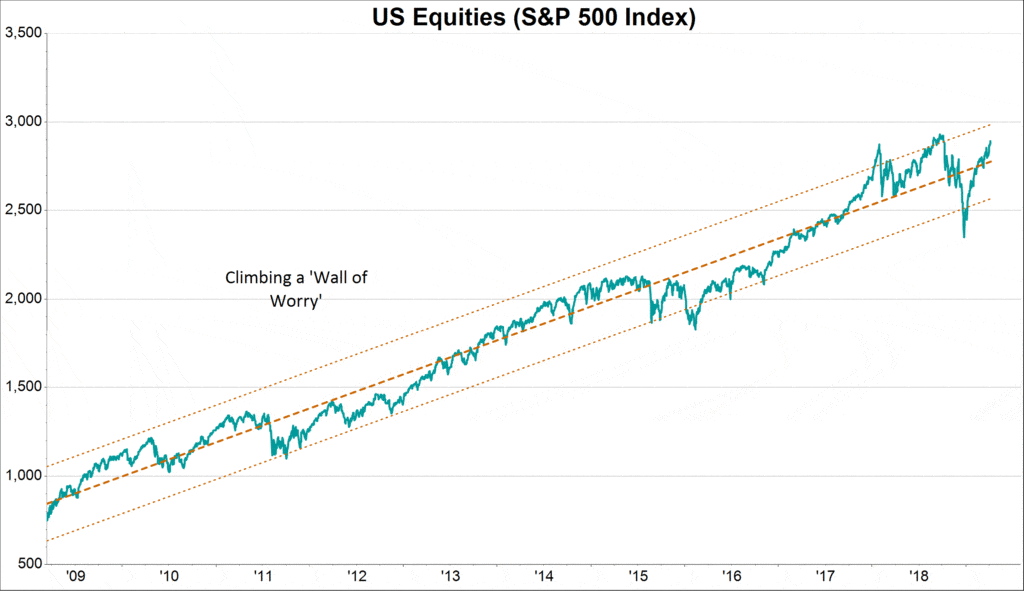 In this article we try to add a perspective, looking back on the factors supporting the seeming inexorable rise and we look forward to how some of these factors may evolve.
Why do stocks rise in value?
The value of an equity or stock is only the sum of future earnings or dividends from that stock adjusted for the cost of money. If the rate of growth in earnings or dividends is greater than the return on an investment in a risk-free asset, then stocks may increase in value. The valuation placed on the current and future earnings of stocks is, of course, also important as are extraneous factors such as the rate of inflation.
Company earnings reflect the underlying performance of the economy. So, let’s look at some hard facts:
- Since March 2009, the U.S. economy, measured as GDP, has grown nearly 50%. Even adjusting for inflation, the U.S. economy is 25% larger in real terms than in March 2009.
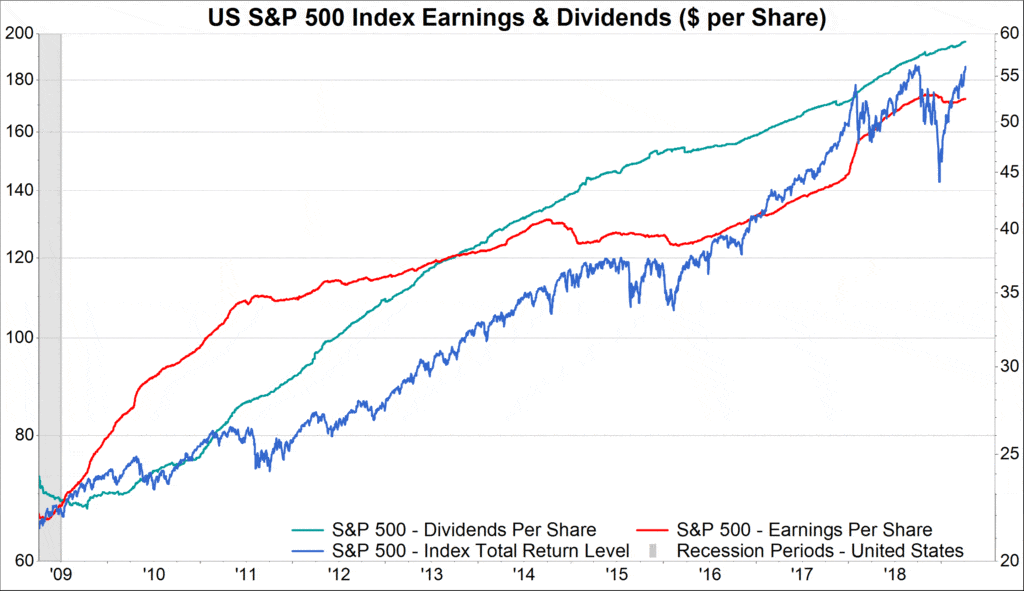
- The earnings of the constituents of the S&P 500 Index have increased by 156% over the last ten years. Dividends have similarly increased by 150%.
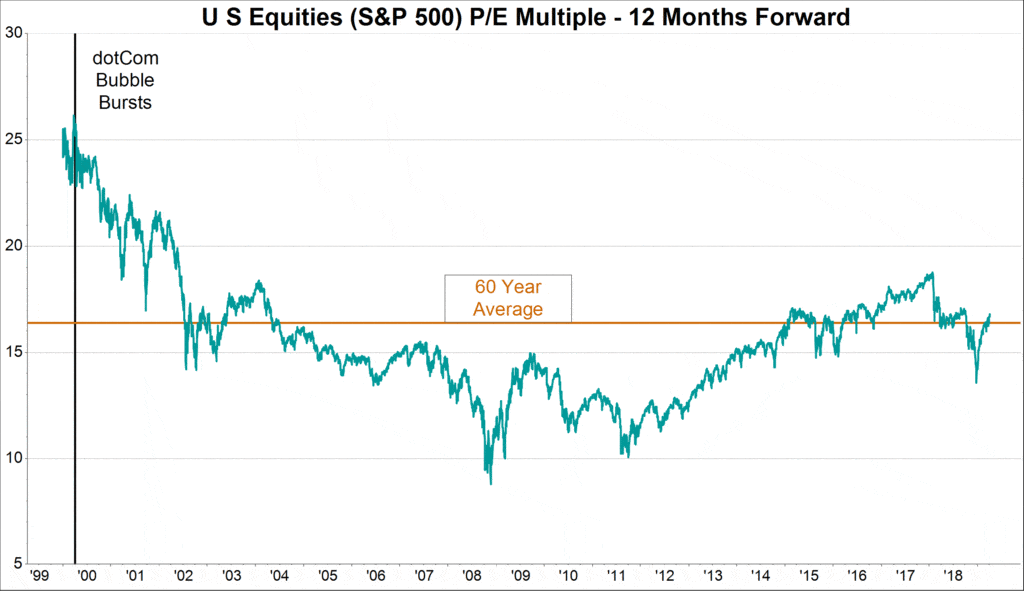
- The valuation placed on the average company in the S&P 500 Index is currently sixteen times next twelve months’ earnings. This number compares with ten times earnings in March 2009. The current valuation, however, is in line with the average for the last sixty years. At the height of the dotcom frenzy in 2000, the valuation was much higher at over twenty-six times earnings.
- Interest rates, bond yields and inflation have also played their part. The Federal Reserve Bank (Fed), reduced interest rates to 0.25% in March 2009 where they stayed for nearly seven years. This move was followed by other major central banks although in the case of the European Central Bank, 0.25% interest rates were not put in place until late 2013 falling to zero in early 2016.
The collapse in interest rates has, of course, had a significant impact on the ten-year Treasury yield which is normally regarded as the risk-free rate of return. By subtracting an earnings-based yield from the risk-free rate of return the resulting Equity Risk Premium is a measure of the extent of over or under valuation of stocks. The higher the value, the greater the attractiveness of equities. At the depth of the financial crisis equities reached a peak of attraction in November 2008. This was followed by a further investing opportunity in October 2011 as the EuroZone economic crisis unfolded, throwing doubt at the ability of the U.S. economy to navigate calmer waters. A more ‘normal’ level for this measure is still significantly lower than the current value leaving plenty of room for stocks to become over-valued.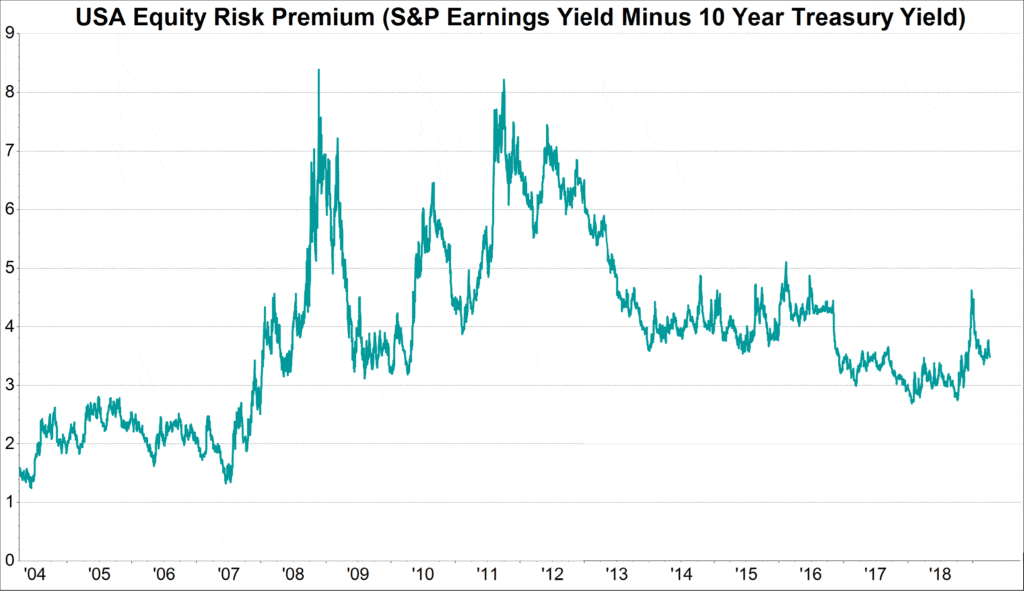 On balance, we can say the performance of both the economy and companies have supported the increase in stock market values over the last ten years, without stocks becoming over-valued.
What has changed since the end of 2018?
The short answer to this question is ‘the Federal Reserve Bank (Fed) has changed’. Throughout 2018, the Fed tightened monetary policy aggressively. First, by increasing interest rates from 0.5% at the start of the year to 2.5% by the year end. Its second, and arguably more damaging, policy was to sell $500 billion of the $4.6 trillion of bonds it had purchased in order to inject liquidity into the economy. This move effectively transferred the equivalent of 2.5% of the U.S. economy from the private to the public sector.
By the end of 2018, the global economy had slowed markedly with some developed economies in Europe flirting with recession. Global equity markets had been falling for most of the year and fringe ‘investments’ such as bitcoin had collapsed in price. Even the U.S. economy felt less robust. By the holiday season, the domestic stock market began to suffer. This dramatic move started to erode consumer confidence which led to a sharp rise in the personal savings ratio: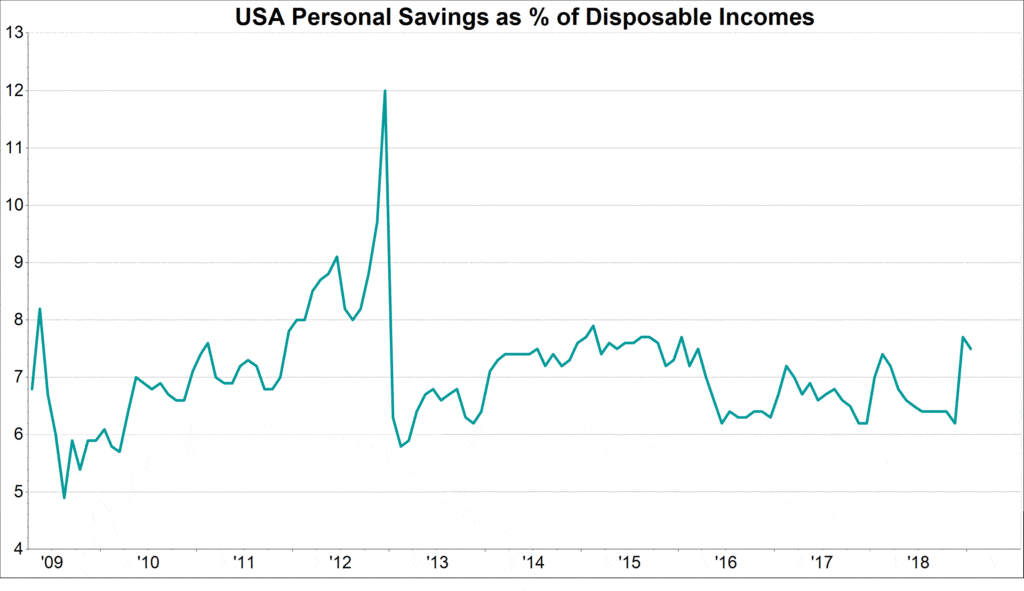 This is very unusual as still relatively low interest rates and very low unemployment levels normally prompt consumers to spend and take on credit. This did not happen, and retailers had their worst holiday season since 2009.
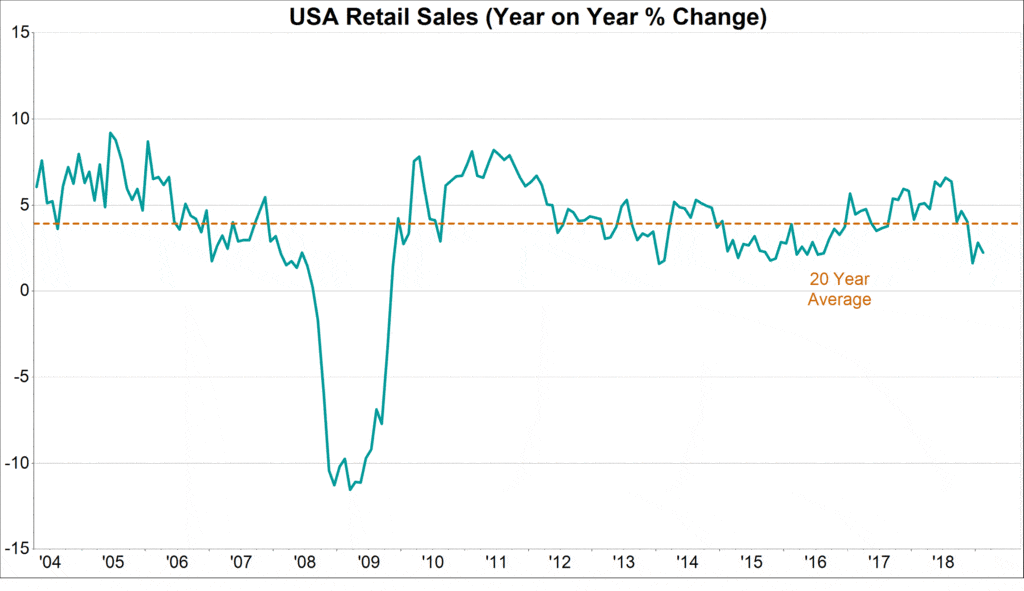 U.S. stocks registered their worst December in terms of performance since the Great Depression. The first quarter 2019, however, has just registered the best opening quarter for 20 years. The reason for this significant change in direction can again be seen in central bank action.
At the start of 2019 the Federal Reserve Bank changed policy dramatically in the wake of this slower economic activity and the stock market correction in December. By announcing no further interest rate rises for the whole of 2019 and a significant reduction in bond sales, this represents a complete about turn on the policy guidance in December.
For the manufacturing sector, growth also reduced towards the end of 2018 and into the current year. The dramatic slowdown in the European and Chinese economies and the strength of the U.S. dollar helped to reduce export orders. Domestic manufacturing activity, however, has remained robust with purchasing managers reporting reduced growth but still at a significantly higher level than for China, Japan and the EuroZone: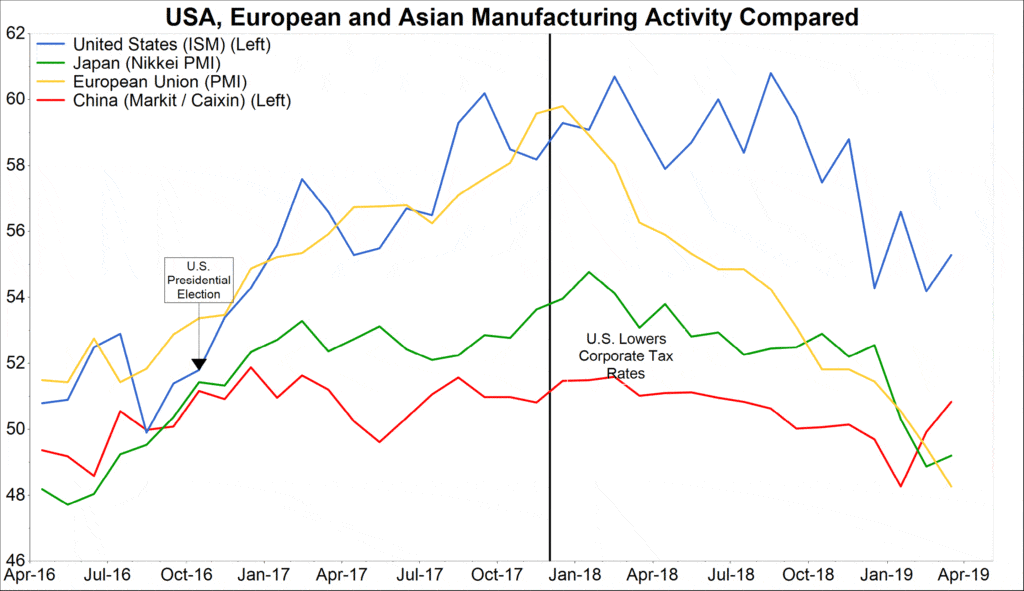 For these surveys, any reading above 50 implies expansion and below, contraction. The U.S. remains well into expansion territory while Europe and Japan appear to be contracting.
The recovery in China is encouraging. The authorities have embarked on a program of stimulation, lowering interest rates, encouraging lending and recently have announced a package of stimulus designed to promote domestic demand. The successful completion of a trade deal with the U.S. will, of course, help.
For Europe, the agony surrounding the UK’s decision to leave the European Union (EU) appears to have had a dramatic impact on the UK’s principal trading partners.
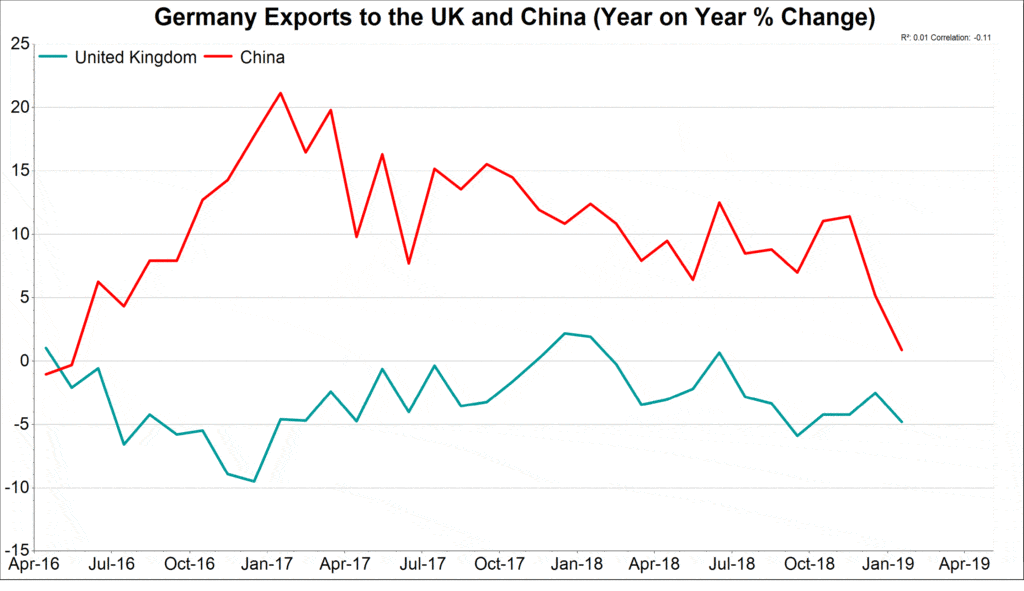
The three largest economies in Europe, Germany, France and Italy are all teetering on the verge of recession. The extent of the problem can be seen in the mainstay of the German economy – the manufacturing sector: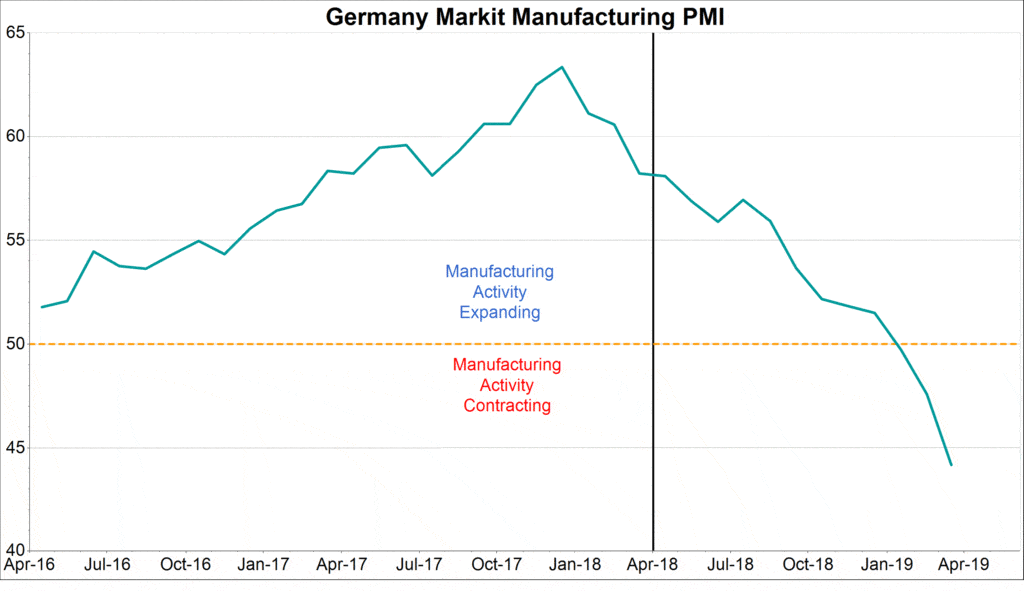 The German government has blamed poor demand from China for their dire performance. While this may have been a contributor, the UK is the country’s third largest export market after the U.S. and just behind France. Recent trade data show that exports to the UK have fallen by 5% over the last year while exports to China are increasing in value, albeit slightly:
 The UK government has already pledged to stimulate the economy when Brexit finally takes place. Given the difficulties within the EuroZone economy, a stimulus package from Germany may not be far behind.
Conclusion
Looking ahead, it seems the main global central banks will either maintain very easy monetary policies or even attempt more stimulus. It is also possible that all major economies will have government spending packages in place. The implications for the investment markets are that pro- growth policies will be in place. This should be helpful for company earnings and so provide support for the equity markets. The ever-present risk, however, will remain tightness in labor markets and consequent inflation pressures. At present, these risks appear some way off.
So, as we celebrate the tenth anniversary of this extraordinary bull market and reflect on the potential risks, let’s also place the recent rise in the context of the last ninety years: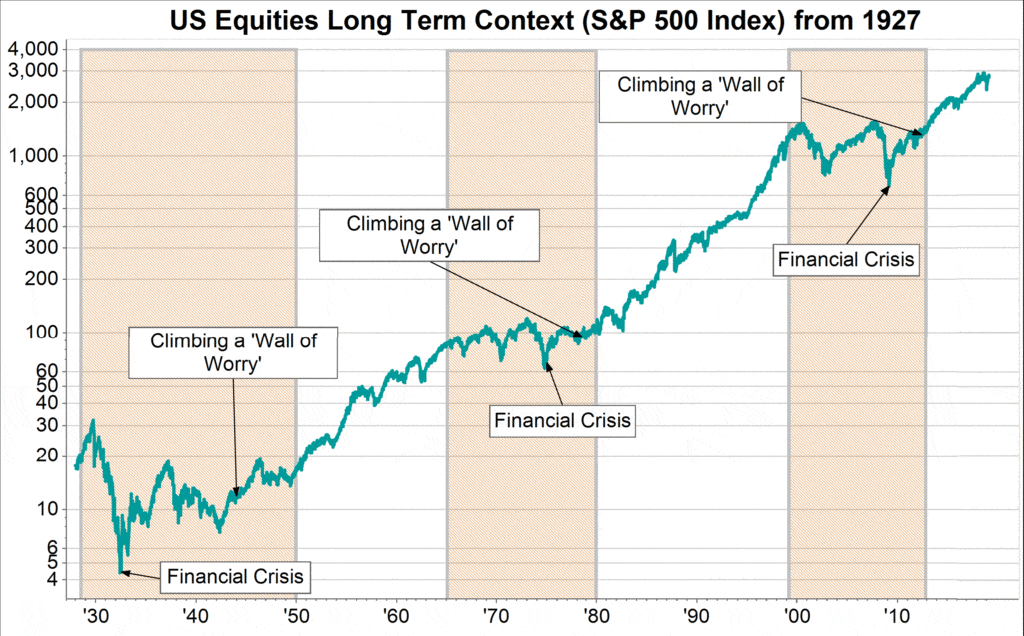 The shaded areas are periods where the stock market as measured by the S&P 500 Index ‘moved’ sideways over an extended number of years. The fifteen year, five-fold increase in the index from 1950 and the ten-fold increase in the index over the twenty years from 1980 appear similar to the trajectory experienced since early 2013. Just as the sideways moves in markets are associated with financial crises, the extended moves higher reflect technological change, stimulating earnings growth. Market corrections are an important feature of these step moves higher as we can see in 1958, 1962, 1982,1987 and in 1991. While we do not expect an imminent and extended market set back, periodic corrections are normal. A balance of low risk investments can help counter expected volatility in stocks, helping overall long term portfolio performance.
Written by:
Trevor Forbes
President and Chief Investment Officer
Source of all graphs: FactSet
This newsletter is limited to the dissemination of general information pertaining to Renaissance’s investment advisory services. It is for informational purposes only and should not be construed by a consumer and/or prospective client as a solicitation to effect, or attempt to effect transactions in securities, or the rendering of personalized investment advice for compensation. Renaissance’s specific advice is given only within the context of our contractual agreements with each client. Advice may only be rendered after delivery of Form ADV Part 2 and the execution of an agreement by the client and Renaissance.


